UnityBreak Message and Photos


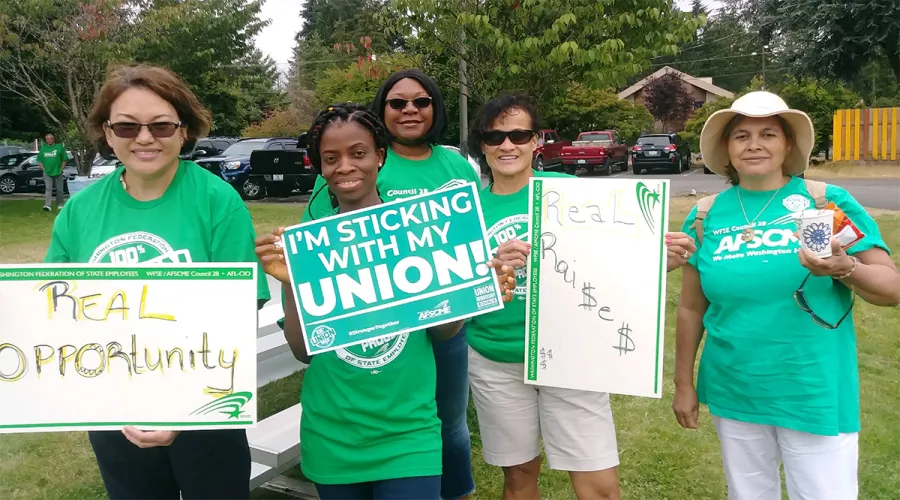
CLICK IMAGE ABOVE TO VIEW UNITY BREAK PHOTOS
~
State employees cannot move forward together when we continue to fall behind economically.
87% of state employees are behind market rate
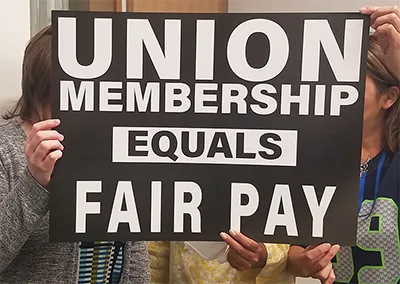
We need fair pay and affordable healthcare now! It's time to close the gap on pay for state employees.
TAKE ACTION for #FairPay and #AffordableHealthcare — contracts that improve our communities and ensure a stable workforce.
Join one of the statewide workplace UNITY BREAKS to show our strength for fair pay and affordable healthcare.

From our 7/11/18 GG Bargaining Update:
The revolving door of state service has not stopped. Workloads are ever increasing from 30% state employee turnover in the last 3 years.
At the same time, population growth is estimated to be 200,000 during the life of the 2019-21 agreement. Under Office of Financial Managements’ previous, stringent rules, this is enough to justify recruitment & retention increases for all members.
The result of this is more and more new and potentially untrained workers with ever increasing workloads. In fact, 36% of the workforce are in their first 5 years of employment.
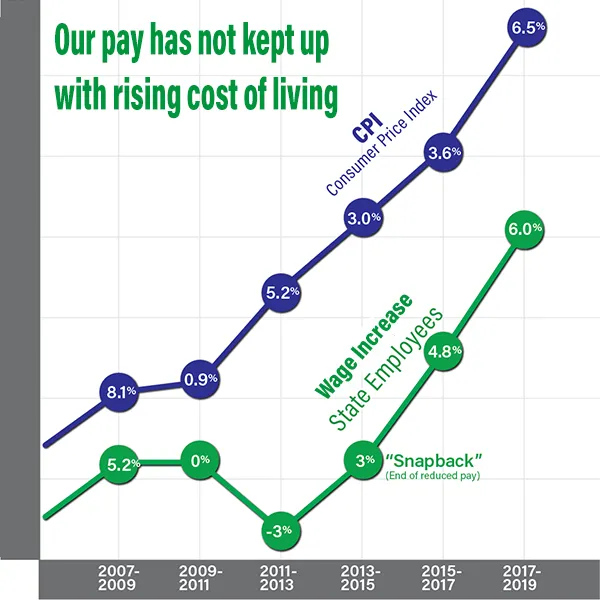
Since 2008 the cost of living has risen 19.46%. It is projected to increase another 14.2% over the course of the next few years (2018-’23).
Total cost of living increase of 33.66% are needed from 2008-2023. Since 2008 state wages have increased 12.8%, over 20% short of the projected cost of living in Washington state.
We must stand together and take actions to achieve fair pay. Let’s seize this real opportunity to stand together united to sustain our families and the communities we serve.
BACKGROUND
Washington State’s Population (Source: OFM):
- 6,468,424 in 2008
- 7,299,857 in 2015
- 7,427,600 estimated population in 2018
- Over the last 10 years, during the recession, 1 million new residents to serve
- Represents a 15% population increase
- According to forecasting, will rise another 200,000 during the life of this CBA
Washington’s Workforce (OFM):
- 111,420 in 2008
- 111,204 in 2016
- Currently 113,731 State Government FTE’s
- While this growth is important, it represents only a 9% improvement
- Does not keep up with population, an excellent indicator of citizen need
Employee Turnover (OFM):
- 10.6% turnover in 2015
- 10% turnover in 2016
- 10.4% turnover in 2017
- This means 10% of workforce for several years straight replaced by new, untrained workers
- Even under OFM’s previous, stringent rules, enough to justify R&R increases ATB
- The results of this are more and more new and untrained workers with an ever increasing workload
- In fact, 36% of the workforce are in their first 5 years of employment
- Also concerning, only 11% of workers are under the age of 30 and the largest age group are those 55-59 years of age
- This tells us that the state is still not attracting the next generation of public servants
- http://www.hr.wa.gov/WorkforceDataAndPlanning/WorkforceDataTrends/Pages/WorkforceTurnover.aspx
According to the most recent (2017) employee engagement survey, only 53% of employees are satisfied with how their work environment affects their well-being. Only 63% would recommend working in their agency. It is also telling that longer term employees tend to provide significantly less positive responses to the survey. Much of this is the result of serving hundreds of thousands more citizens with less resources while maintaining high quality. As the data shows, many state employees are new to their work which means they may not possess the training and skills yet to work independently. All of these factors combined means that we continue to see a dangerous level of recruitment and retention problems, crushing workloads, and a work environment that approximately half of all employees say has a negative impact on their overall well-being.
It is equally important that we give you a clear understanding of what it’s like trying to pay the bills and even support a family as a dedicated public servant.
Salary Survey (OSHRD):
- The Employer’s own 2014 Salary Survey showed 81% of workers were behind market rates
- 2016 Salary Survey showed 99% of workers behind market rates - 66% were more than 25% behind market rates – some as far as 90% behind
- 2018 Salary Survey still shows, in spite of work done last round, 87% of workers are behind market rates – 48% more than 25% behind – some as far as 155% behind
- Exec summaries of the Salary Survey’s consistently state that salary ranges are more competitive at the entry level but less competitive toward the top of each range
- An obvious factor in the recruitment & retention crisis that continues today
- http://hr.wa.gov/CompClass/Compensation/Pages/TotalCompensationSurvey.aspx
General COL Increases (OFM/Seattle CPI-U All):
- Since 2008 the cost of living has risen 19.46%
- It is projected to increase another 14.2% over the course of the next few years (‘18-’23)
- Total increase of 33.66%
- Since 2008 state wages have increased 12.8%, over 20% short of the projected cost of living in WA State
- According to a June 2018 news story, median homes prices in Seattle are now $830k and the area has led the nation in home price increases for 20 months in a row. The article also cites information from ESD that shows wages increasing at less than half the rate of home prices.
- https://pilotonline.com/business/jobs/article_4121df68-03e6-5bf6-9c35-0e98c5f60817.html
Benefits:
- Health Care – In 2007 EE paid 12%, now paying 15% of a dramatically rising cost plus surcharges
- Pension Contributions – PERS2 began in 2006 at 2.25%, is now 7.38%, 1.28% more than when we last met in 2016
- All of this means less income for the families of state workers to live on
- http://www.drs.wa.gov/publications/member/multisystem/contributionrates.htm
MEDIA CONTACT: Greg Devereux, Executive Director at 800-562-6002
